|

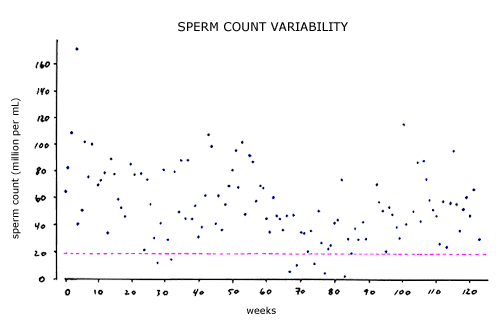
This scatter diagram displays the sperm count variability (in millions per mL) that occurred when the same man produced (biweekly) samples over a greater than 2 year period of time. This individual reportedly received no medication and had no febrile illness during these 120 weeks. Graph is based upon data collected by Dr. C.A. Paulsen.
The lower limit of normal for sperm concentration is usually considered to be 20 million per mL (pink dashed line in this diagram). Of note, on several occasions during this collection period the sperm concentration was below this “normal” concentration. For this reason, when a low sperm count (concentration) is detected in an initial semen analysis then a repeat semen analysis should be obtained to assess whether this low count could simply be due to normal variability.
|

|